List of U.S. states by population
Jump to navigationJump to search

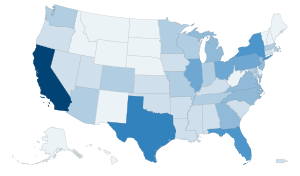
This is a list of United States of America states by population as of 2019. The list was made using the 2019 Census estimates taken by the United States Census Bureau. The total population of the United States was 330,150,668 at the December 2019 Census.
These numbers include all people other than people just visiting: These include citizens, non-citizen permanent residents and non-citizen long-term visitors. People in the military who are working in other countries and their families are counted in their home state.[1] The United States of America is the third most populous country in the world, behind China and India.

| Rank in states & territories, 2019 | Rank in states & territories, 2010 | State | Population estimate, July 1, 2019 [2] | Census population, April 1, 2010 [3] | Percent change, 2010–2019 [note 1] | Absolute change, 2010-2019 | Total seats in the U.S. House of Representatives, 2013–2023 | Estimated population per electoral vote, 2019 [note 2] | Estimated population per House seat, 2019 | Census population per House seat, 2010 | Percent of the total U.S. population, 2018 [note 3] |
|---|---|---|---|---|---|---|---|---|---|---|---|
| 1 | 1 | 39,512,223 | 37,254,523 | 6.1% | +2,257,700 | 53 | 718,404 | 745,514 | 702,885 | 11.96% | |
| 2 | 2 | 28,995,881 | 25,145,561 | 15.3% | +3,850,320 | 36 | 763,050 | 805,441 | 698,503 | 8.68% | |
| 3 | 4 | 21,477,737 | 18,801,310 | 14.2% | +2,676,427 | 27 | 740,611 | 795,472 | 696,468 | 6.44% | |
| 4 | 3 | 19,453,561 | 19,378,102 | 0.4% | +75,459 | 27 | 670,812 | 720,502 | 717,707 | 5.91% | |
| 5 | 6 | 12,801,989 | 12,702,379 | 0.8% | +99,610 | 18 | 640,099 | 711,222 | 705,715 | 3.87% | |
| 6 | 5 | 12,671,821 | 12,830,632 | -1.2% | −158,811 | 18 | 633,591 | 703,990 | 712,864 | 3.85% | |
| 7 | 7 | 11,689,100 | 11,536,504 | 1.3% | +152,596 | 16 | 649,394 | 730,569 | 721,032 | 3.53% | |
| 8 | 9 | 10,617,423 | 9,687,653 | 9.6% | +929,770 | 14 | 663,589 | 758,387 | 691,975 | 3.18% | |
| 9 | 10 | 10,488,084 | 9,535,483 | 10.0% | +952,601 | 13 | 699,206 | 806,776 | 733,498 | 3.14% | |
| 10 | 8 | 9,986,857 | 9,883,640 | 1.0% | +103,217 | 14 | 624,179 | 713,347 | 705,974 | 3.02% | |
| 11 | 11 | 8,882,190 | 8,791,894 | 1.0% | +90,296 | 12 | 634,442 | 740,183 | 732,658 | 2.69% | |
| 12 | 12 | 8,535,519 | 8,001,024 | 6.7% | +534,495 | 11 | 656,578 | 775,956 | 727,366 | 2.58% | |
| 13 | 13 | 7,614,893 | 6,724,540 | 13.2% | +890,353 | 10 | 634,574 | 751,489 | 672,454 | 2.28% | |
| 14 | 16 | 7,278,717 | 6,392,017 | 13.9% | +886,700 | 9 | 661,702 | 808,746 | 710,224 | 2.17% | |
| 15 | 14 | 6,949,503 | 6,547,629 | 5.3% | +344,874 | 9 | 626,591 | 765,834 | 727,514 | 2.09% | |
| 16 | 17 | 6,833,174 | 6,346,105 | 7.6% | +483,069 | 9 | 620,834 | 758,797 | 705,123 | 2.05% | |
| 17 | 15 | 6,732,219 | 6,483,802 | 3.8% | +248,417 | 9 | 612,020 | 748,024 | 720,422 | 2.02% | |
| 18 | 18 | 6,137,428 | 5,988,927 | 2.5% | +148,501 | 8 | 613,743 | 767,179 | 748,615 | 1.85% | |
| 19 | 19 | 6,045,680 | 5,773,552 | 4.7% | +272,128 | 8 | 604,568 | 755,710 | 721,694 | 1.83% | |
| 20 | 20 | 5,822,434 | 5,686,986 | 2.4% | +135,448 | 8 | 582,243 | 727,804 | 710,873 | 1.76% | |
| 21 | 22 | 5,758,736 | 5,029,196 | 14.5% | +729,540 | 7 | 639,860 | 822,677 | 720,704 | 1.72% | |
| 22 | 21 | 5,639,632 | 5,303,925 | 6.3% | +335,707 | 8 | 563,963 | 704,954 | 662,991 | 1.70% | |
| 23 | 24 | 5,148,714 | 4,625,364 | 11.3% | +523,350 | 7 | 572,079 | 735,531 | 660,766 | 1.54% | |
| 24 | 23 | 4,903,185 | 4,779,736 | 2.6% | +123,449 | 7 | 544,798 | 700,455 | 682,819 | 1.48% | |
| 25 | 25 | 4,648,794 | 4,533,372 | 2.5% | +115,422 | 6 | 581,099 | 774,799 | 755,562 | 1.41% | |
| 26 | 26 | 4,467,673 | 4,339,367 | 3.0% | +128,306 | 6 | 558,459 | 744,612 | 723,228 | 1.35% | |
| 27 | 27 | 4,217,737 | 3,831,074 | 10.1% | +386,663 | 5 | 602,534 | 843,547 | 766,215 | 1.27% | |
| 28 | 28 | 3,956,971 | 3,751,351 | 5.5% | +205,620 | 5 | 565,282 | 791,394 | 750,270 | 1.19% | |
| 29 | 30 | 3,565,287 | 3,574,097 | -0.2% | −8,810 | 5 | 509,327 | 713,057 | 714,824 | 1.08% | |
| 30 | 35 | 3,205,958 | 2,763,885 | 16.0% | +442,073 | 4 | 534,326 | 801,490 | 690,972 | 0.96% | |
| 32 | 31 | 3,155,070 | 3,046,355 | 3.6% | +108,715 | 4 | 525,845 | 788,768 | 761,717 | 0.95% | |
| 31 | 29 | 3,193,694 | 3,725,789 | -14.3% | −532,095 | 1 (non-voting) | — | 3,193,694 | 3,725,789 | 0.97% | |
| 33 | 36 | 3,080,156 | 2,700,551 | 14.1% | +379,605 | 4 | 513,359 | 770,039 | 675,173 | 0.92% | |
| 34 | 33 | 3,017,825 | 2,915,918 | 3.5% | +101,886 | 4 | 502,967 | 754,451 | 728,990 | 0.91% | |
| 35 | 32 | Mississippi | 2,976,149 | 2,967,297 | 0.3% | +8,852 | 4 | 496,024 | 744,037 | 742,026 | 0.90% |
| 36 | 34 | 2,913,314 | 2,853,118 | 2.1% | +60,196 | 4 | 485,552 | 728,329 | 713,280 | 0.88% | |
| 37 | 37 | 2,096,829 | 2,059,179 | 1.8% | +37,650 | 3 | 419,366 | 698,943 | 686,393 | 0.63% | |
| 38 | 39 | 1,934,408 | 1,826,341 | 5.9% | +108,067 | 3 | 386,882 | 644,803 | 608,780 | 0.58% | |
| 39 | 40 | 1,787,065 | 1,567,582 | 14.0% | +219,483 | 2 | 446,516 | 893,033 | 783,826 | 0.53% | |
| 40 | 38 | 1,792,147 | 1,852,994 | -3.3% | −60,847 | 3 | 358,435 | 597,391 | 617,670 | 0.55% | |
| 41 | 41 | 1,415,872 | 1,360,301 | 4.1% | +55,571 | 2 | 353,968 | 707,936 | 680,151 | 0.43% | |
| 42 | 43 | 1,359,711 | 1,316,470 | 3.3% | +43,241 | 2 | 339,928 | 679,856 | 658,233 | 0.41% | |
| 43 | 42 | 1,344,212 | 1,328,361 | 1.2% | +15,851 | 2 | 336,053 | 672,106 | 664,181 | 0.40% | |
| 44 | 45 | 1,068,778 | 989,415 | 8.0% | +79,363 | 1 | 356,259 | 1,068,778 | 989,417 | 0.32% | |
| 45 | 44 | 1,059,361 | 1,052,567 | 0.6% | +6,794 | 2 | 264,840 | 529,681 | 526,466 | 0.32% | |
| 46 | 46 | 973,764 | 897,934 | 8.4% | +75,830 | 1 | 324,588 | 973,764 | 897,934 | 0.29% | |
| 47 | 47 | 884,659 | 814,180 | 8.7% | +70,479 | 1 | 294,886 | 884,659 | 814,180 | 0.27% | |
| 48 | 49 | 762,062 | 672,591 | 13.3% | +89,471 | 1 | 254,021 | 762,062 | 672,591 | 0.23% | |
| 49 | 48 | 731,545 | 710,231 | 3.0% | +21,314 | 1 | 243,848 | 731,545 | 710,231 | 0.22% | |
| 50 | 51 | 705,749 | 601,723 | 17.3% | +104,026 | 1 (non-voting) | 235,250 | — | — | 0.21% | |
| 51 | 50 | 623,989 | 625,741 | -0.3% | -1,752 | 1 | 207,996 | 623,989 | 625,741 | 0.19% | |
| 52 | 52 | 578,759 | 563,626 | 2.7% | +15,133 | 1 | 192,920 | 578,759 | 563,626 | 0.17% | |
| 53 | 53 | 165,718 | 159,358[4] | 4.0% | +6,360 | 1 (non-voting) | — | — | 0.05% | ||
| 54 | 54 | 104,914 | 106,405[5] | -1.4% | −1,491 | 1 (non-voting) | — | — | 0.03% | ||
| 55 | 55 | 55,641 | 55,519[6] | 0.22% | +122 | 1 (non-voting) | — | — | 0.02% | ||
| 56 | 56 | 55,194 | 53,883[7] | 2.4% | +1,311 | 1 (non-voting) | — | — | 0.02% | ||
| — | — | Contiguous United States | 325,386,357 | 306,675,006 | 6.2% | +19,011,351 | 432 | 616,262 | 753,209 | 708,285 | 98.38% |
| — | — | The fifty states | 327,533,795 | 308,143,836 | 6.3% | +19,389,959 | 435 | 612,213 | 752,951 | 708,405 | 99.02% |
| — | — | Fifty states + D.C. | 328,300,544 | 308,745,538 | 6.3% | +19,493,985 | 435 (+ 1 non-voting) | 610,111 | — | — | 99.24% |
| — | — | Total U.S. (including D.C. and territories) | 331,814,684 | 312,846,492 | 5.7% | +17,897,562 | 435 (+ 6 non-voting) | — | — | 100.00% |
- ↑ This figure for each state compares to a national increase of 5.97%.
- ↑ Each state has a number of votes in the Electoral College equal to two more than its number of representatives in the U.S. House, while DC is granted 3 electoral votes. The Electoral College is used to elect the President and Vice President of the United States.
- ↑ Because of rounding of the individual percentages, the entries in this column may not sum to 100%.
References[change | change source]
- ↑ "Will 2010 Census apportionment population counts also include any Americans overseas?". Census Help. United States Census Bureau. Retrieved 26 April 2019.
- ↑ "Annual Estimates of the Resident Population for the United States, Regions, States, and Puerto Rico: April 1, 2010 to July 1, 2019". 2010-2019 Population Estimates. United States Census Bureau, Population Division. December 30, 2019. Retrieved January 27, 2020.
- ↑ "Resident Population Data: Population Change". United States Census Bureau. December 23, 2010. Archived from the original on December 25, 2010. Retrieved December 23, 2010.
- ↑ "Archived copy". Archived from the original on September 24, 2011. Retrieved September 12, 2010.CS1 maint: archived copy as title (link)
- ↑ "Archived copy". Archived from the original on November 1, 2012. Retrieved December 13, 2012.CS1 maint: archived copy as title (link)
- ↑ "Archived copy". Archived from the original on July 23, 2012. Retrieved September 11, 2012.CS1 maint: archived copy as title (link)
- ↑ "Archived copy". Archived from the original on December 23, 2010. Retrieved March 2, 2012.CS1 maint: archived copy as title (link)